 CryptoChain Blog
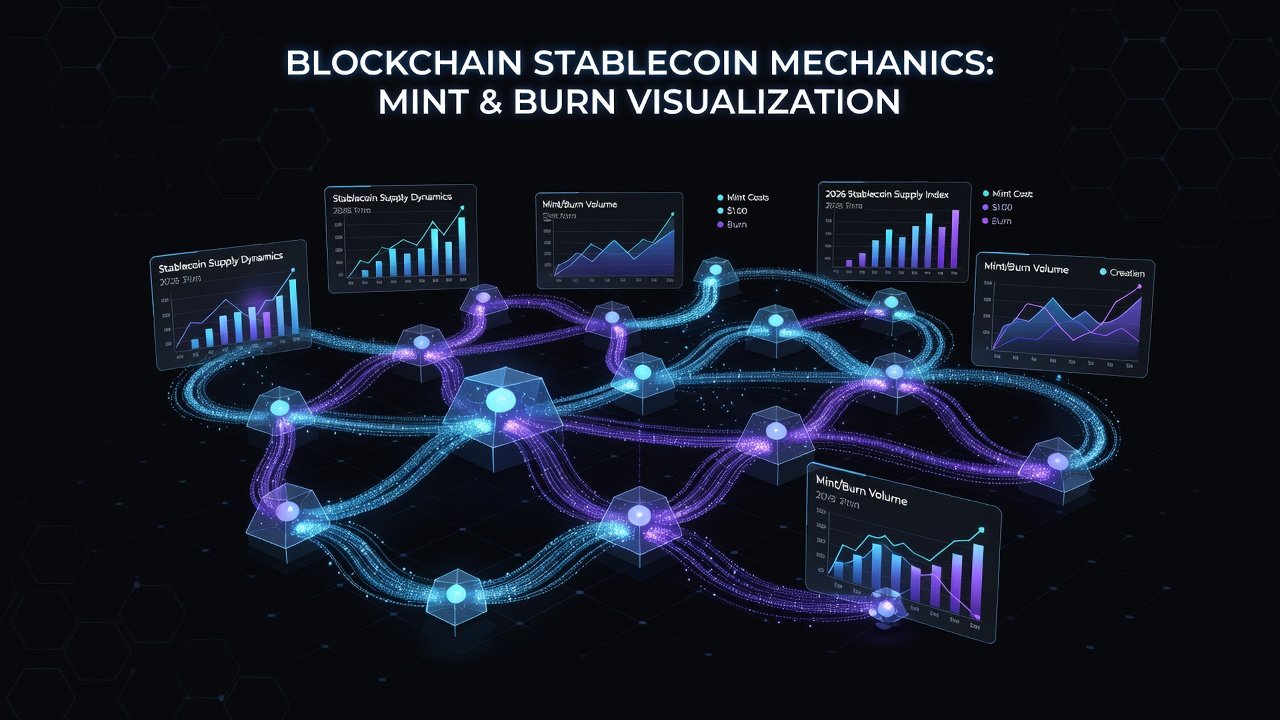
Understanding Stablecoin Mint and Burn Mechanics in 2026
Stablecoins like USDT and USDC form the backbone of onchain liquidity in decentralized finance. Mint and burn mechanics directly control circulating supply, influencing price stability, velocity, and redemption flows. In 2026, analysts rely on real-time blockchain data to interpret these events as signals of market health and sustainability. These mechanics ensure that token supply always matches verified reserves, creating a transparent bridge between traditional finance and blockchain ecosystems.
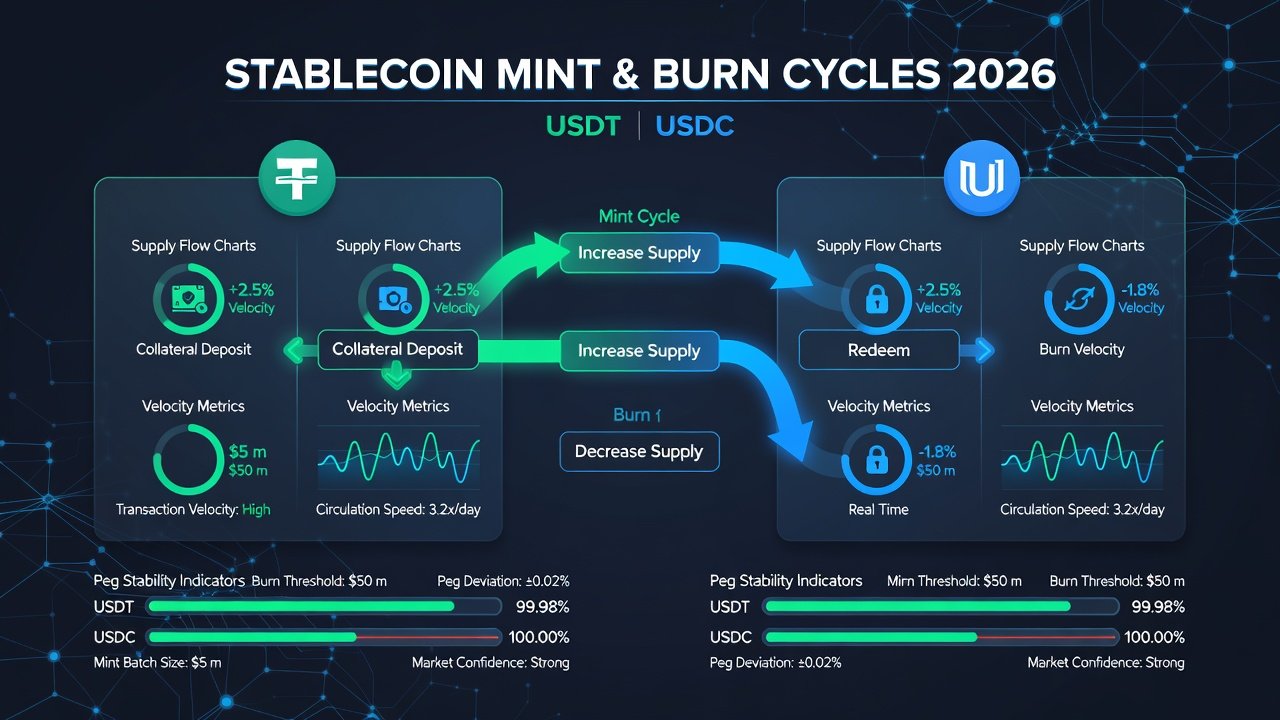
Minting occurs when an issuer deposits fiat reserves and creates new tokens onchain. Burning removes tokens from circulation when users redeem them for underlying assets. These processes create transparent supply adjustments visible across major networks including Ethereum, Tron, and Solana. Understanding the timing and scale of these events helps DeFi participants anticipate liquidity shifts and potential volatility.
Real-Time Tracking of Issuance and Burn Events
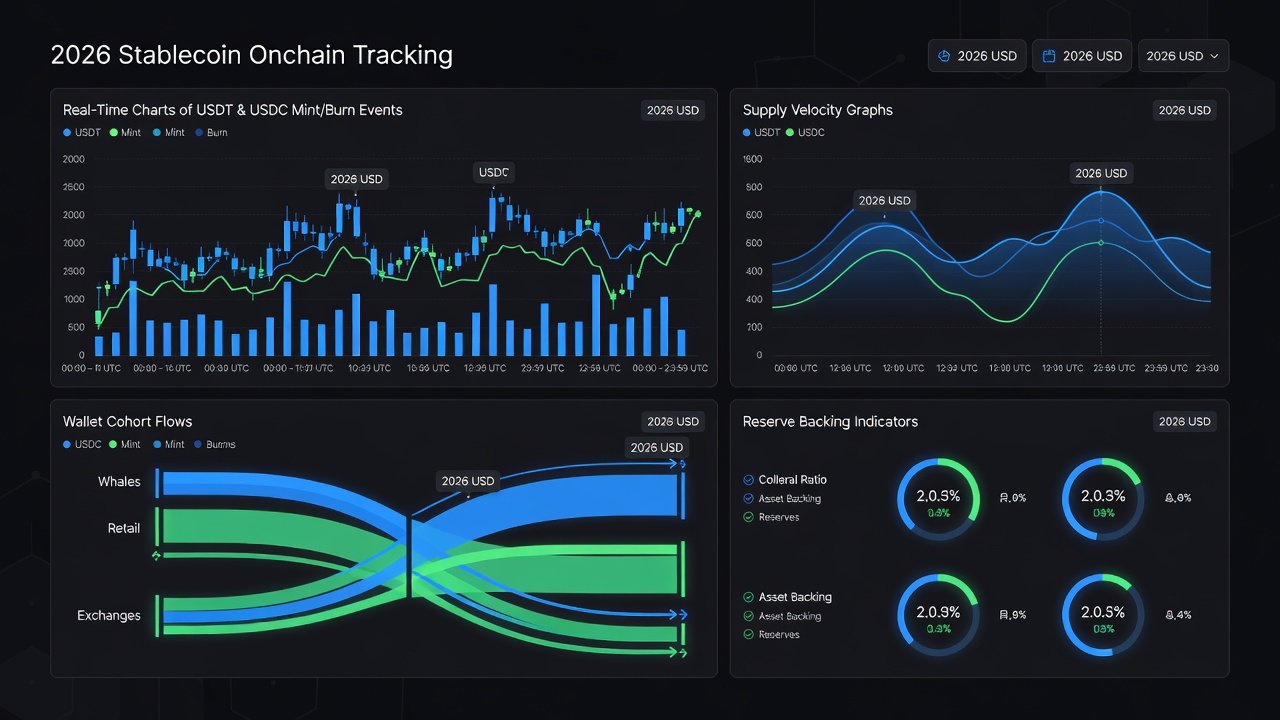
Onchain explorers and analytics platforms allow monitoring of mint and burn transactions in real time. Key events appear as large transfers from issuer-controlled addresses to or from circulation. Analysts track these to gauge demand spikes or contraction phases. For example, a sudden cluster of mint transactions on a high-throughput chain like Solana may reflect growing retail adoption or new protocol integrations seeking stable liquidity.
Conversely, clustered burns often signal redemptions during risk-off periods. Cross-chain visibility reveals where liquidity is migrating, allowing analysts to compare activity across ecosystems. Tools that aggregate data from multiple networks provide a holistic view of global stablecoin flows and their correlation with broader market sentiment.
Step-by-Step Workflow for Monitoring USDT Patterns
Begin by identifying official issuer wallets for Tether. Monitor the primary minting contract on supported chains. Use transaction filters to isolate mint events above a threshold size. This approach surfaces meaningful movements rather than noise from small transfers.
- Query recent transactions from the issuer address using block explorers such as those connected to Tether's official resources.
- Label mints versus burns by direction of token flow and verify against known contract signatures.
- Segment by wallet cohorts such as exchanges, DeFi protocols, and OTC desks to understand participant behavior.
- Correlate events with price action and reserve attestations published periodically by the issuer.
- Track velocity changes in the 24 to 72 hours following major mint or burn activity.
This workflow highlights supply expansion tied to trading volume or contraction during volatility, giving analysts early warnings of shifting demand.
Step-by-Step Workflow for Monitoring USDC Patterns
Circle publishes transparent reserve data and onchain activity. Focus on the official USDC issuer address and associated blacklisted or compliance addresses. Analysts often combine onchain queries with offchain attestations for fuller context.
- Track issuance transactions from the Circle treasury wallet and note the exact block timestamps.
- Analyze burn transactions linked to redemption requests, filtering for amounts that exceed typical retail thresholds.
- Apply cohort analysis to separate retail from institutional flows and identify concentration risks.
- Compare velocity metrics before and after major events to measure circulation speed.
- Cross-reference with data from Circle's transparency portal for reserve backing confirmation.
USDC burns frequently align with banking settlement cycles, providing predictable signals for liquidity forecasting and protocol risk management.
Wallet Cohort Analysis and Supply Dynamics Across Chains
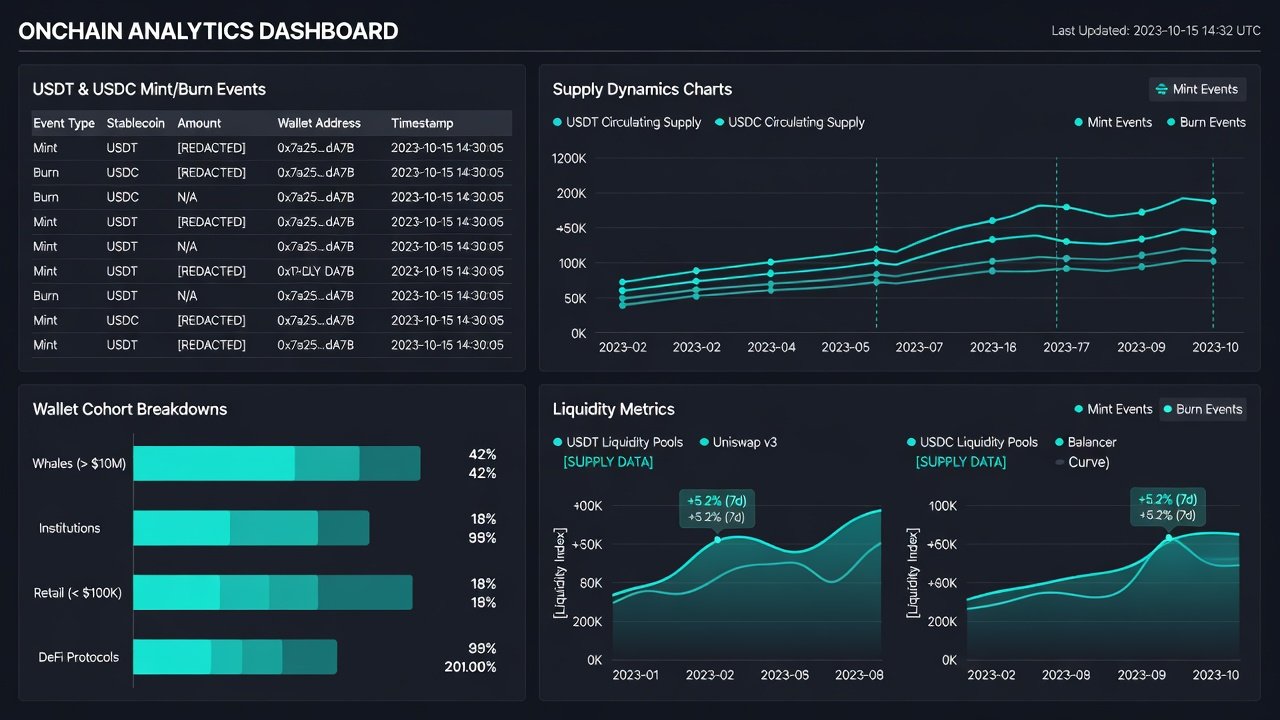
Breaking down holders into cohorts reveals sustainability signals that raw supply numbers alone cannot show. Exchange wallets often absorb mints during bull phases, acting as distribution hubs, while protocol treasuries show longer holding periods that stabilize velocity. Large burns from OTC addresses may indicate off-ramping by institutions seeking fiat settlement.
Velocity metrics measure how quickly tokens circulate through the ecosystem. High velocity post-mint suggests active trading and DeFi engagement, while low velocity after burns points to hoarding or reduced activity. Comparing these across chains helps identify the most resilient liquidity pools. On Ethereum, higher gas costs can slow velocity compared to Tron or Solana, where lower fees encourage more frequent transfers and redemptions.
Practical Comparisons of Redemption Impacts on Liquidity
Redemptions affect liquidity differently depending on the stablecoin and chain. USDT redemptions on Tron tend to show faster settlement than on Ethereum due to lower fees and higher throughput. USDC redemptions often involve more regulatory checks, slowing velocity temporarily but adding compliance assurance for institutional users.
Analysts compare pre- and post-redemption liquidity depth on decentralized exchanges by examining order book thickness and slippage rates. Sustained burns without corresponding price deviation indicate healthy reserve backing and strong issuer controls. Sudden mint surges without matching demand can hint at temporary oversupply that protocols must absorb through yield incentives or collateral adjustments.
Actionable Tips for DeFi Analysts and Tokenomics Evaluation
- Automate alerts for mint or burn transactions exceeding typical thresholds to catch material supply changes immediately.
- Cross-reference onchain flows with offchain reserve reports from issuers to validate sustainability claims.
- Monitor multiple chains simultaneously to capture migration trends and avoid single-network blind spots.
- Build dashboards that overlay cohort flows with velocity indicators for visual pattern recognition.
- Review historical patterns around macroeconomic events for predictive context and scenario planning.
- Integrate data from explorers like Etherscan with cohort labeling tools to refine wallet segmentation accuracy.
- Evaluate redemption impacts on specific protocols by simulating liquidity scenarios before large events materialize.
FAQ on Interpreting Mint and Burn Flows for Tokenomics Health
What does a large mint event signal?
A large mint typically reflects new demand or capital inflows, increasing circulating supply while maintaining the peg through reserve expansion. It often precedes increased trading activity on exchanges and DeFi platforms.
How do burns affect tokenomics health?
Burns reduce supply and can strengthen the peg if demand remains constant, often indicating redemptions or reduced leverage in the system. Persistent burns without reserve strain demonstrate robust backing mechanisms.
Which metrics best reveal sustainability?
Track reserve attestation frequency, cohort concentration ratios, cross-chain velocity trends, and correlation between mint or burn volume and onchain trading activity. Consistent alignment between these signals points to healthy tokenomics.
How should analysts handle cross-chain discrepancies?
Compare settlement speeds, fee structures, and user bases across networks. Discrepancies often highlight where capital is flowing for efficiency or regulatory reasons, informing allocation decisions.
By mastering these mechanics and workflows, analysts gain clearer visibility into stablecoin-driven tokenomics and can make more informed decisions in evolving 2026 markets.
No comments yet. Be the first!