 CryptoChain Blog
Stablecoin Issuer Reserves 2026: Onchain Circulation Breakdown
Stablecoin reserves form the backbone of trust in decentralized finance. In 2026, onchain tracking has become essential for analysts seeking to understand circulation patterns, redemption risks, and liquidity dynamics across major protocols. This guide examines issuer-level data, velocity calculations, and practical monitoring strategies that help DeFi participants make informed decisions amid evolving market conditions.
Understanding how reserves are maintained and how tokens move onchain allows analysts to identify potential vulnerabilities before they escalate. Major issuers publish periodic attestations, yet these snapshots often lag behind real-time blockchain activity. Combining both data sources creates a more reliable framework for evaluating stability and sustainability of tokens such as USDT, USDC, and DAI.
Understanding Issuer Reserve Tracking
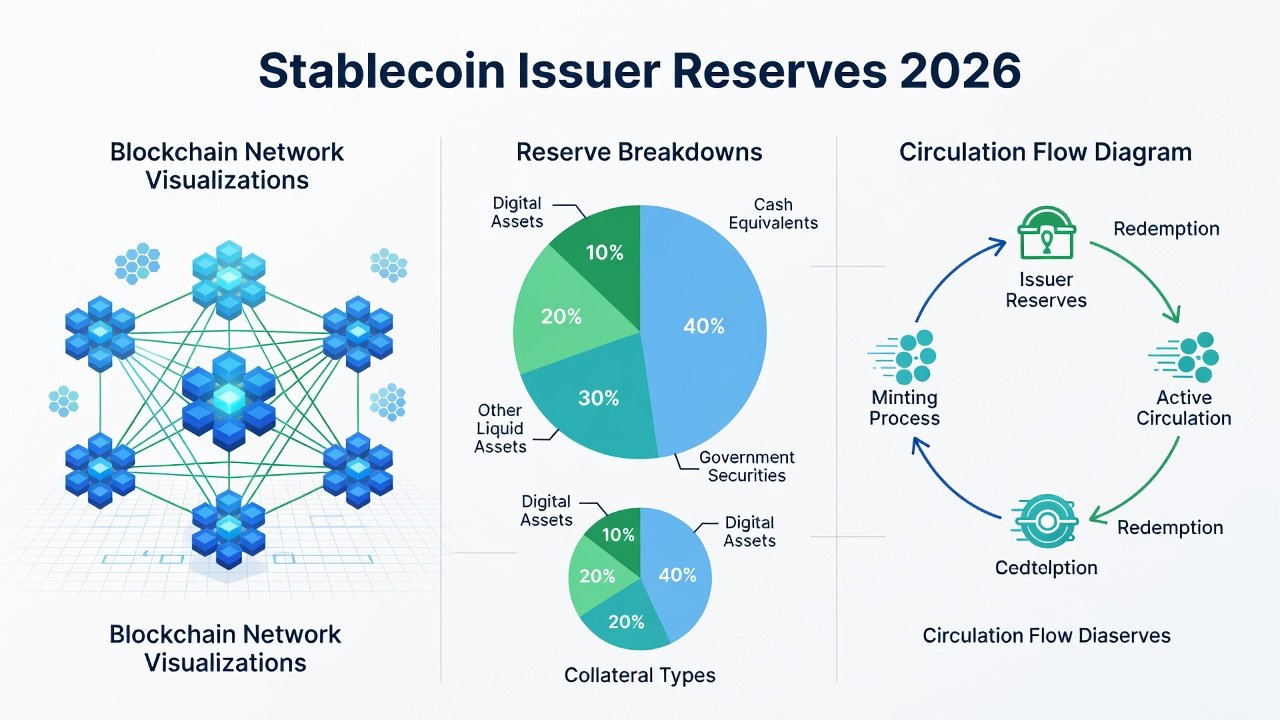
Reserve tracking involves monitoring the assets backing stablecoins like USDT and USDC. Issuers publish attestations, but onchain data reveals real-time circulation beyond offchain reports. Analysts combine blockchain explorers with dashboard tools to verify backing and detect shifts early. In 2026, reserve composition has grown more complex with exposure to short-term treasuries, repurchase agreements, and diversified cash equivalents. Tracking these components requires cross-referencing issuer disclosures with live onchain mint and burn events to ensure the circulating supply remains fully collateralized at all times.
Calculating Velocity of Stablecoin Circulation
Velocity measures how frequently a stablecoin changes hands. The formula is total transaction volume divided by average circulating supply over a period. For example, high velocity often signals active DeFi usage, while low velocity may indicate hoarding in wallets. Tools like Dune Analytics help compute these metrics across Ethereum and other chains. Analysts typically examine 7-day, 30-day, and 90-day rolling windows to identify seasonal patterns or protocol-specific usage spikes. Velocity spikes can precede large liquidity events, while sustained low velocity may point to accumulation strategies by long-term holders or treasuries.
Analyzing Whale Wallet Concentration
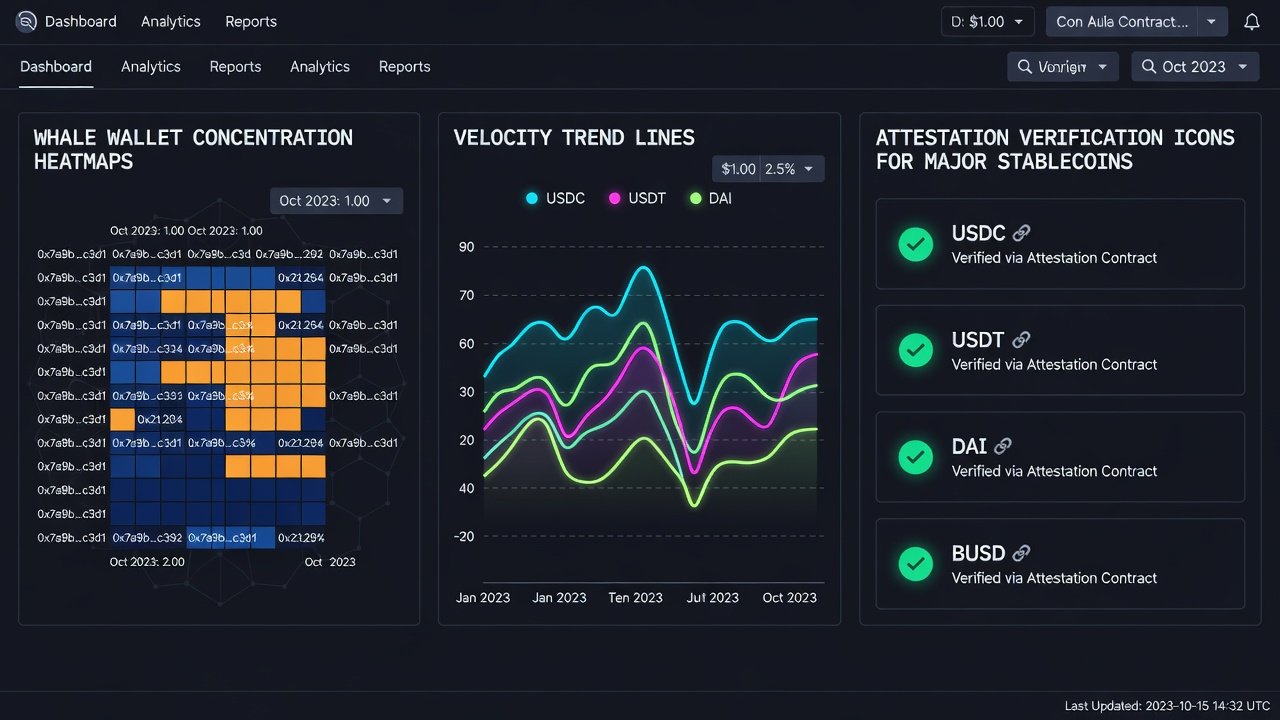
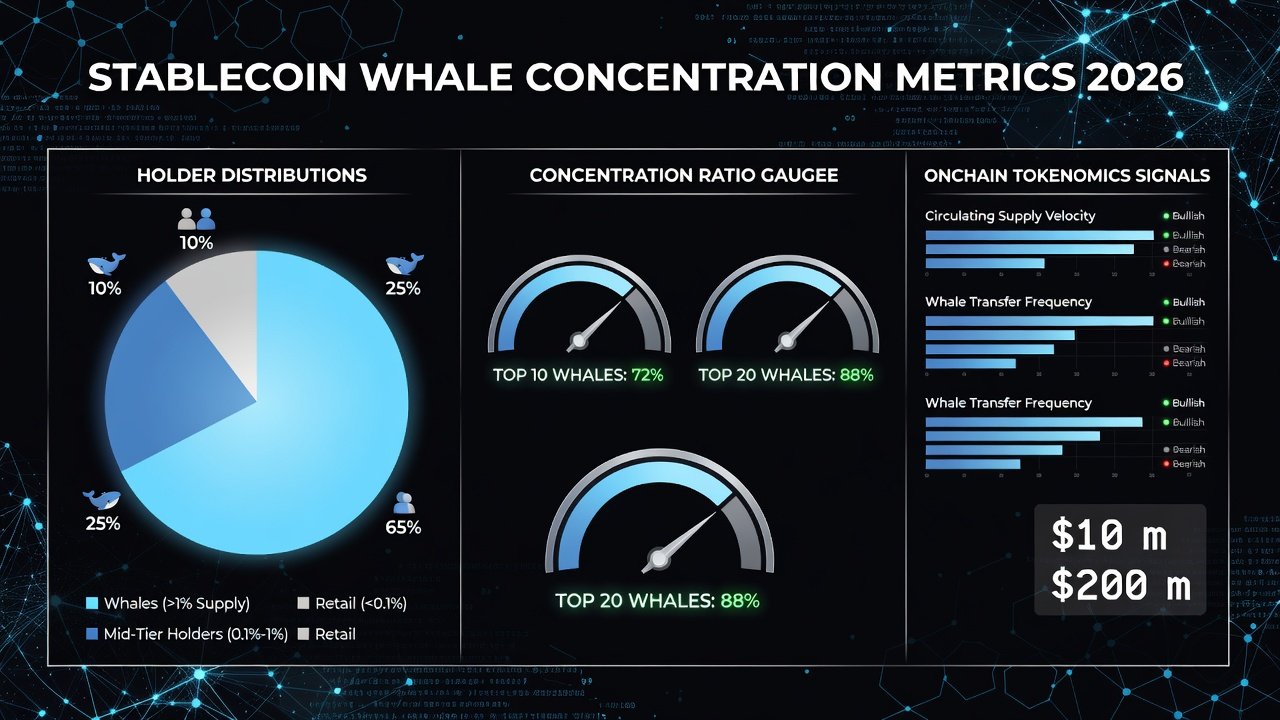
Whale wallets holding large stablecoin balances can influence market stability. Concentration risks rise when a few addresses control significant portions of supply. Onchain analytics platforms flag these patterns, allowing analysts to anticipate potential sell pressure or liquidity events. In practice, wallets labeled as exchanges, custodians, or market makers require separate treatment from anonymous high-balance addresses. Monitoring concentration ratios above 30 percent in the top 100 wallets often serves as an early warning threshold for analysts focused on systemic risk.
Integrating Attestation Data with Onchain Metrics
Attestations from auditors provide snapshots of reserves. Integrating these with onchain flows creates a fuller picture. Discrepancies between reported reserves and actual circulation can highlight transparency gaps. Regular cross-verification reduces exposure to issuer-specific risks. In 2026, leading issuers release attestations monthly or quarterly, yet onchain data updates continuously. Analysts build custom dashboards that overlay attestation dates with mint/burn volumes to spot timing mismatches that could signal operational stress or delayed reporting.
Real-Time Monitoring Tools for 2026 Analysts
Key platforms include DefiLlama for protocol-level data and Etherscan for transaction tracing. Step-by-step example: Search a stablecoin contract address, review holder distributions, then cross-reference with attestation reports on issuer sites such as Tether. Additional workflows involve setting API alerts for large transfers exceeding 10 million tokens and comparing multi-chain supply across Ethereum, Tron, and Solana. Analysts also integrate Circle transparency reports to validate USDC reserve backing in real time.
Spotting Redemption Risks and Liquidity Shifts
Redemption risks appear through sudden reserve drawdowns or mismatched mint/burn events. Use explorers to monitor large transfers to exchange wallets. Liquidity shifts often precede depegging events, so setting alerts on dashboards helps analysts react promptly. Practical indicators include a sudden increase in transfers to known custodian addresses combined with declining onchain liquidity in major DEX pools. Case examples from early 2026 showed that monitoring the ratio of reserve attestations to outstanding supply helped flag potential stress days before market prices reacted.
Centralized vs Decentralized Stablecoin Models
Centralized issuers like those behind USDC rely on traditional banking partners and regular attestations. Decentralized models use overcollateralization and algorithmic mechanisms. Case study: USDC demonstrated resilience during banking stress through transparent reserves, while algorithmic alternatives faced volatility from onchain liquidation cascades. Centralized tokens generally offer clearer offchain backing but introduce counterparty concentration risk, whereas decentralized versions expose users to smart-contract vulnerabilities and collateral volatility. Analysts compare both models by tracking reserve coverage ratios and liquidation thresholds side by side.
Practical Case Studies in 2026
Consider a major USDT issuance event. Onchain data showed rapid circulation into DeFi lending pools, increasing velocity by over 30 percent within weeks. Another example involved a decentralized stablecoin where whale concentration exceeded 40 percent, prompting community governance proposals for diversification. A third case examined cross-chain bridging activity that temporarily inflated circulating supply on a secondary network without corresponding reserve increases, creating temporary arbitrage opportunities and subsequent corrective flows.
Common Mistakes to Avoid
- Ignoring multi-chain circulation data that can mask true supply distribution
- Over-relying on single attestation reports without verifying live onchain flows
- Failing to track historical velocity trends that reveal usage pattern shifts
- Neglecting wallet labeling for accurate concentration analysis across exchanges and custodians
- Overlooking seasonal or protocol-upgrade impacts on redemption volumes
Step-by-Step Guide to Using Blockchain Explorers
Begin by locating the official contract address on the issuer website. Next, filter transactions by date range matching the latest attestation period. Review top holders and categorize them into exchange, DeFi protocol, and unknown buckets. Finally, cross-check large outflows against known redemption addresses to confirm whether reserve movements align with onchain activity.
Conclusion
Effective stablecoin analysis in 2026 demands blending issuer attestations with granular onchain insights. By mastering velocity, whale metrics, and monitoring workflows, analysts can better navigate redemption risks and support sustainable token economics across both centralized and decentralized models.
FAQ
What are the main red flags in stablecoin reserve transparency?
Red flags include delayed attestations, large unexplained reserve drawdowns, and high concentration in unlabeled wallets that lack clear custodian identification.
How do I calculate onchain velocity?
Divide total onchain transfer volume by average supply over the chosen timeframe using explorer or analytics dashboards, then compare across multiple time windows for trend accuracy.
Are centralized stablecoins safer than decentralized ones?
Centralized models offer clearer attestations but introduce counterparty risk, while decentralized versions depend on collateral quality and smart contract security for ongoing stability.
Which tools best integrate attestation and onchain data?
Platforms like DefiLlama combined with issuer portals from Circle and Tether provide strong starting points for integrated analysis, supplemented by custom Dune Analytics queries for deeper customization.

No comments yet. Be the first!