 CryptoChain Blog
Introduction to Stablecoin Mint and Burn Cycles in 2026
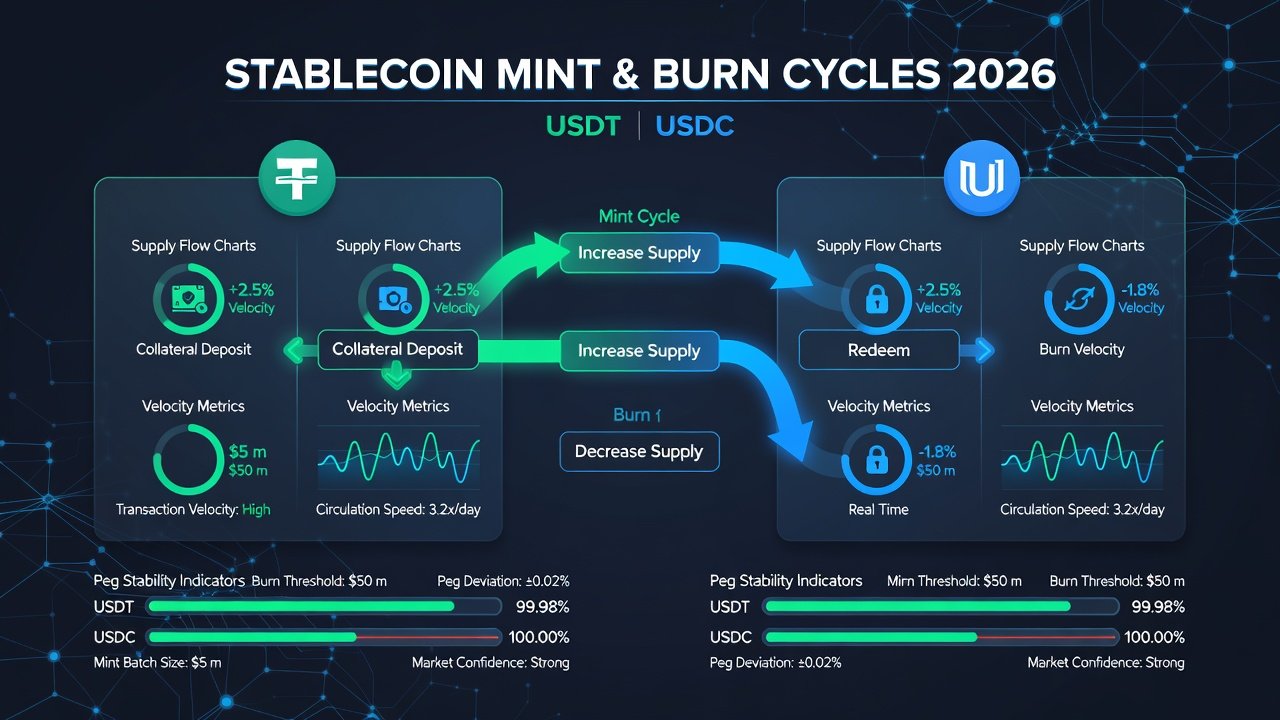
Stablecoin mint and burn cycles represent the foundational mechanism behind onchain tokenomics, directly shaping circulating supply, transaction velocity, and peg stability across major assets. In 2026, DeFi analysts and institutional participants use advanced blockchain monitoring to interpret these events in real time. Minting introduces new stablecoin units into circulation, typically backed by reserves, while burning removes them during redemptions or adjustments. These cycles provide critical signals about issuer health, market demand, and potential risks to peg integrity.
Net issuance, calculated as mints minus burns, influences everything from liquidity in decentralized protocols to broader market sentiment. This playbook delivers comprehensive guidance on tracking these dynamics, including workflows, case studies for USDT and USDC, wallet cohort analysis, calculation methods, issuer comparisons, and dashboard setups. By mastering these elements, analysts can make informed decisions and identify unsustainable patterns early.
Real-Time Monitoring Workflows Using Blockchain Analytics Tools
Real-time monitoring begins with establishing reliable data pipelines from public blockchains and analytics platforms. Focus on Ethereum, Tron, and Solana, which host the majority of stablecoin transactions. Start by identifying issuer reserve addresses and setting up automated queries for mint and burn events exceeding predefined thresholds, such as $5 million or higher.
Integrate multiple tools for layered insights. Blockchain explorers allow direct transaction inspection, while specialized platforms aggregate metrics across chains. Configure alerts for unusual activity patterns, including clustered mints from specific wallet cohorts or sudden burn spikes indicating mass redemptions. Combine onchain data feeds with issuer transparency reports to cross-verify reserve movements and avoid false signals from internal treasury operations.
- Label and segment wallet cohorts including exchanges, DeFi protocols, market makers, and institutional treasuries for targeted tracking.
- Implement API-based monitoring to calculate daily net issuance automatically and flag deviations from historical averages.
- Monitor cross-chain transfers that often precede major mint or burn events as liquidity shifts between networks.
- Review historical event logs to establish baselines for normal versus anomalous cycle behavior in 2026 market conditions.
Advanced workflows incorporate machine learning models trained on past cycle data to predict upcoming supply changes. This proactive approach helps analysts stay ahead of volatility triggered by large-scale redemptions.
USDT and USDC Case Studies: Supply Dynamics in Action
Tether's USDT exhibits pronounced mint cycles during periods of heightened market activity, often followed by burn waves as participants redeem for fiat or reallocate capital. In 2026 examples, large USDT mints frequently coincide with increased trading volumes on centralized platforms and inflows into lending protocols. These mints expand supply rapidly, but subsequent burns can tighten liquidity if demand does not keep pace.
Circle's USDC demonstrates more measured cycles with emphasis on maintaining strict peg adherence. Case studies reveal that USDC burns often stem from regulatory-compliant redemptions, providing clearer signals of institutional sentiment. Wallet cohort analysis shows that both assets experience significant activity from exchange hot wallets during high-volatility periods, while DeFi protocol treasuries contribute steady but smaller-scale burns for yield optimization.
Comparative examination of 2026 data highlights how USDT's broader reserve composition leads to more variable cycle lengths compared to USDC's conservative approach. These patterns underscore the importance of issuer-specific monitoring for accurate tokenomics assessment.
Calculating Net Issuance Effects on Velocity and Peg Stability
Accurate calculation of net issuance starts with aggregating all mint and burn transactions over chosen timeframes. The core formula is Net Issuance = Cumulative Mints - Cumulative Burns. Positive values indicate supply expansion that may increase velocity if paired with rising transfer volumes, while negative values suggest contraction and potential redemption pressure.
Velocity assessment divides total onchain transfer volume by average circulating supply during the period. For instance, a 20 percent rise in net issuance alongside flat volume signals possible dilution risks. Peg stability analysis correlates these figures with price deviation metrics, noting that sustained negative net issuance often precedes deviations beyond 0.5 percent from the dollar peg.
Practical examples include reviewing weekly data where a series of $50 million burns without offsetting mints reduced effective velocity by 15 percent in affected protocols. Analysts should apply multi-chain aggregation and adjust for wrapped variants to obtain precise readings. Regular recalculation across rolling windows reveals trend acceleration or reversal points essential for risk management.
Comparisons Across Issuers and Redemption Queue Signals
Issuer comparisons extend beyond basic metrics to evaluate reserve quality, attestation frequency, and operational transparency. USDT cycles reflect a more flexible asset base that can support faster scaling but introduces variability in burn timing. USDC prioritizes high-quality reserves, resulting in steadier but sometimes slower response to market shifts.
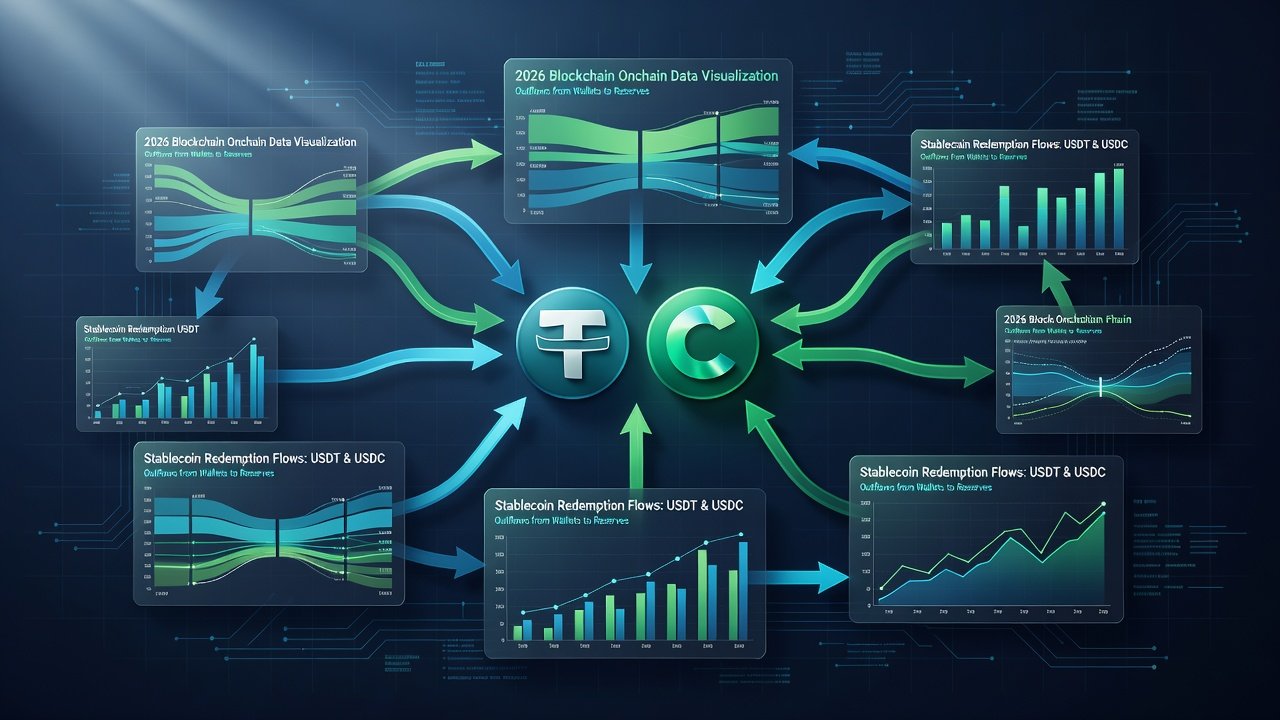
Redemption queue signals serve as leading indicators. Growing queues at issuer portals often precede large burn events by hours or days, allowing analysts to anticipate supply contractions. Monitoring queue length alongside onchain flows provides early warnings of liquidity stress or strong institutional demand.
Cross-issuer dashboards should track relative net issuance ratios and cohort behaviors to identify divergences that signal shifting market preferences between stablecoins.
Practical Dashboards for DeFi Analysts
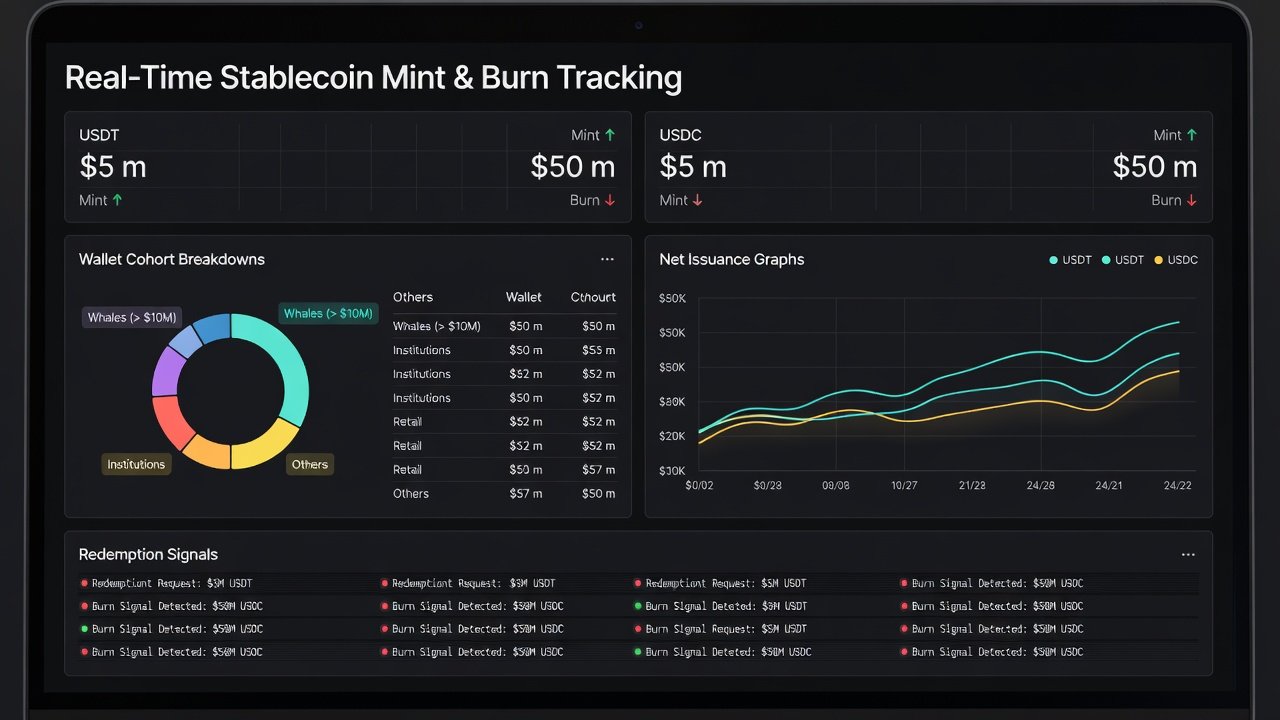
Building effective dashboards requires combining data sources into unified visualizations. Include core panels for real-time mint and burn tallies, net issuance trends, velocity calculations, and peg deviation alerts. Segment views by wallet cohort to isolate exchange-driven activity from protocol-level movements.
Advanced setups incorporate heatmaps of redemption queue activity and historical cycle overlays for pattern recognition. Analysts benefit from customizable thresholds that trigger notifications when net issuance crosses critical levels affecting portfolio allocations. Integration with external data like trading volumes enhances context for decision-making.
Understanding Wallet Cohort Impacts
Wallet cohort analysis deepens insights by categorizing participants and tracking their specific contributions to cycles. Exchange cohorts often drive mint surges during deposit inflows, while DeFi protocol wallets generate consistent burn activity through automated strategies. Institutional cohorts produce large, infrequent events that can swing net issuance dramatically.
Tracking these groups reveals concentration risks and helps forecast cycle sustainability. For example, heavy reliance on a few exchange wallets for mints may indicate fragile demand sources.
Advanced Redemption Queue Analysis and Mistakes to Avoid
Advanced queue monitoring involves timestamp correlation with onchain burns and volume spikes. Common mistakes include ignoring cross-chain effects or failing to distinguish treasury burns from external redemptions. Analysts should always validate signals with multiple data layers to prevent misinterpretation.
FAQs on Spotting Unsustainable Cycles and Optimizing Decisions
How do I spot unsustainable mint-burn patterns?
Identify patterns through repeated large mints detached from demand indicators or clustered burns around known stress events. Divergence between supply growth and actual transfer velocity frequently indicates underlying weaknesses.
What tools help optimize portfolio decisions?
Leverage integrated analytics from Tether, Circle, DefiLlama, and Etherscan to align cycle data with protocol exposure and adjust holdings proactively.
Can mint-burn cycles predict peg deviations?
Persistent negative net issuance combined with rising redemption queues reliably forecasts potential peg stress, enabling timely rebalancing.
How should analysts handle multi-chain stablecoin activity?
Aggregate data across networks while accounting for bridging delays to maintain accurate net issuance views and avoid underestimating total supply dynamics.
What role do wallet cohorts play in long-term tokenomics health?
Diverse cohort participation supports healthier cycles, whereas concentration in few wallets increases vulnerability to sudden shifts in mint or burn behavior.
Conclusion
Mastering stablecoin mint and burn cycles equips analysts with the depth needed to navigate 2026 tokenomics effectively. Through detailed monitoring, precise calculations, issuer comparisons, and robust dashboards, professionals can safeguard portfolios against unsustainable patterns while capitalizing on healthy supply dynamics. Apply these strategies consistently to maintain resilience in evolving DeFi landscapes.
No comments yet. Be the first!